


If You Ever Needed More Evidence To Properly Diversify…
We’ve said it before. There is nothing better than seeing a few concise, clear pictures that demonstrate (again) why as investors we follow the path we do. Dimensional Fund Advisors (DFA) recently came out with a piece that may help you to remember what we absolutely believe to be true. That is (in their words):
- Returns can vary sharply from one period to another
- Holding a broadly diversified portfolio can help smooth out the swings, and
- Focusing on known drivers of higher expected returns can increase the potential for long-term success
Reminders like this can also help us to answer certain questions we should naturally have from time to time. Questions such as “why would I continue to hold an investment that (in the short-term) has simply stunk?” To understand this more, let’s first start by looking at US Stocks (S&P 500) in the first decade of the 21st century (2000-2009) versus the second (2010 until June 2019). Note that you can click on each image to see a larger view:
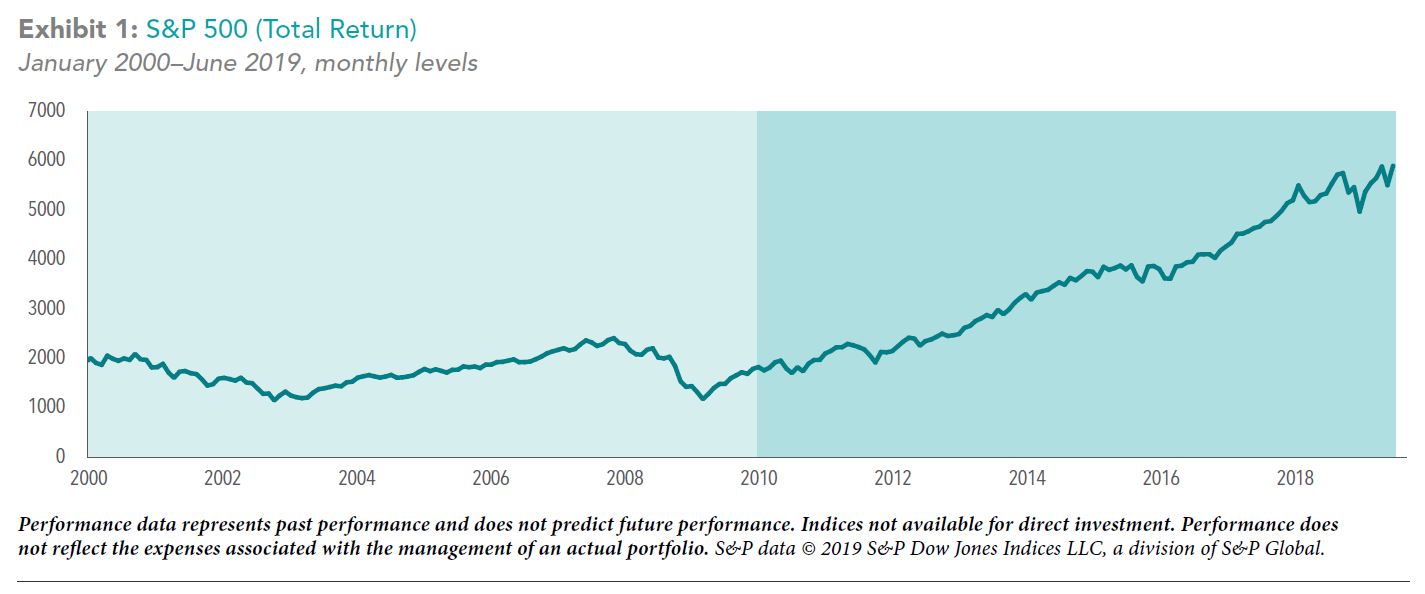
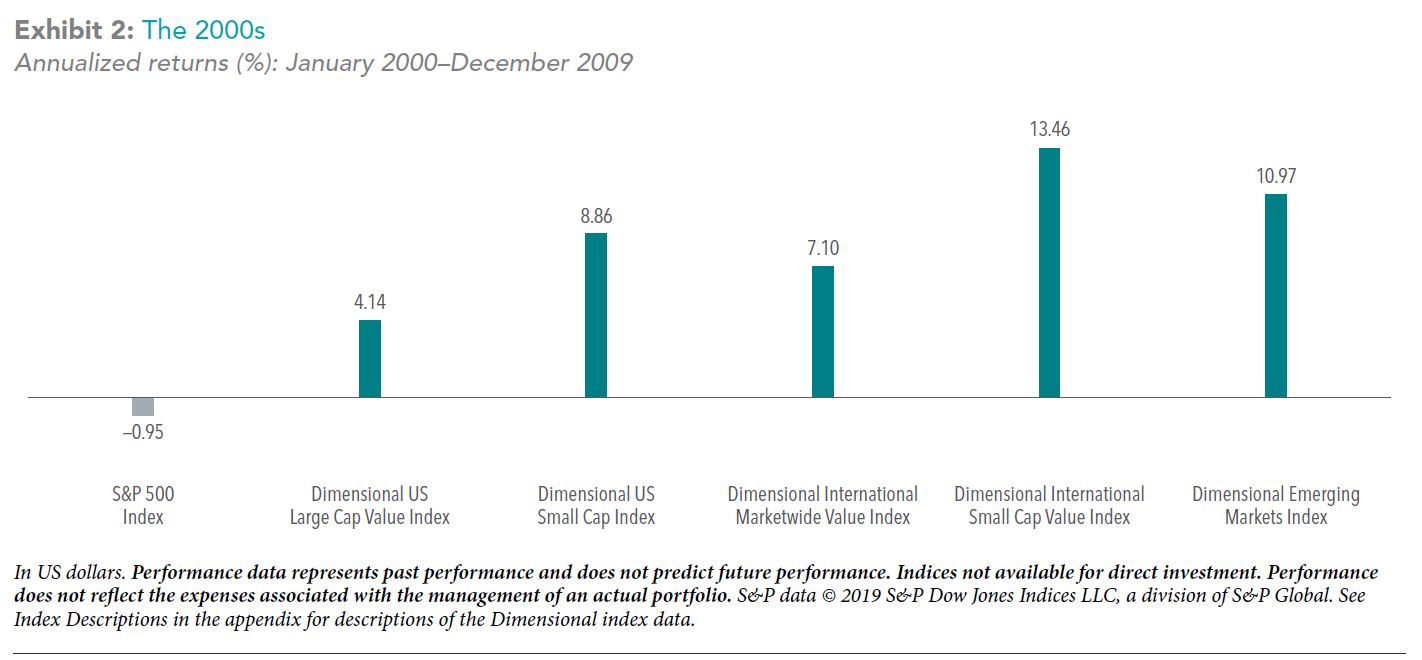
If you’re like me, you may be glad that US Stocks are held in portfolios in some way, given their run over the last ten years. But what concerns me more is seeing that first decade (at left). What if US stocks go through a long period of time like this, and you’re just beginning to take income now from your portfolio? Fortunately, there is something that (while no guarantee) could help. It’s those other pieces of the puzzle, outside of simply investing in US “large cap” stocks (as much as we like them). Because for those investors that globally diversified across large and small companies, etc. it’s a very different picture, as shown below. As you can see in the first decade, US stocks returned an average loss of -0.95% per year, while other areas had higher returns:
When we fast forward to the most recent decade drawing to a close, however, we can easily see that US stocks have been the winner during this period:
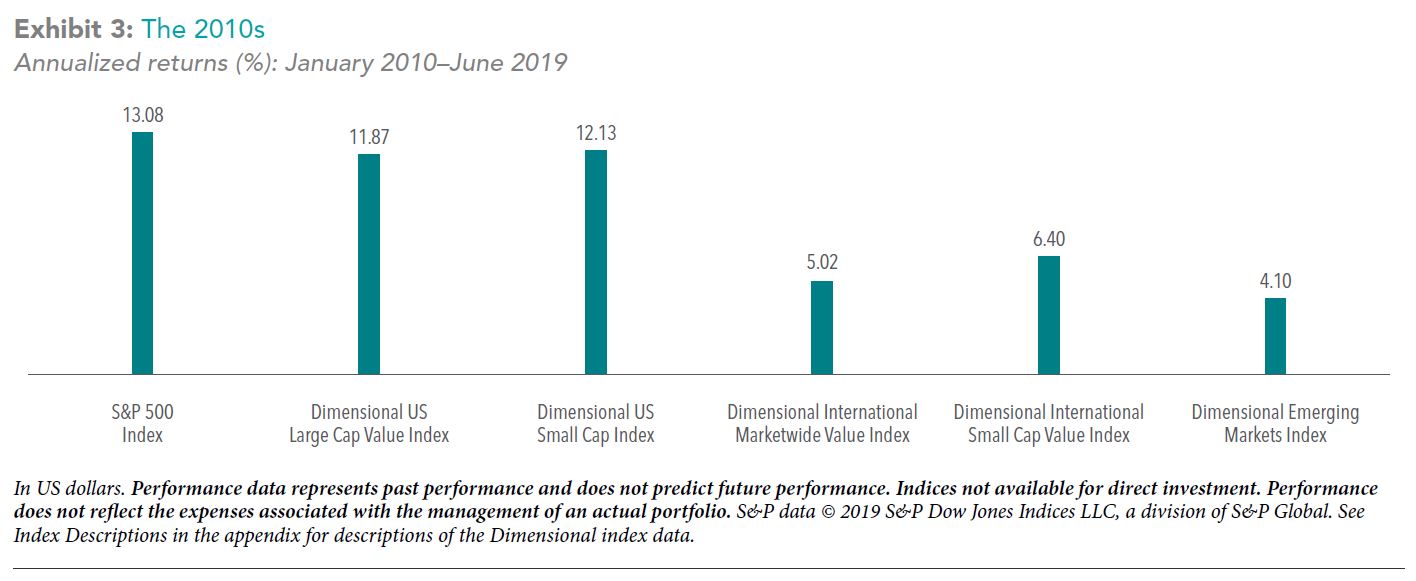
Through the entire (almost) twenty-year period, the S&P 500 returned 5.65% per year, while the other indices returned between 6.08% and 10.44%. Of course, with higher expected returns come higher expected “risk”, which is in the form of volatility. And that has to be factored in when determining what you want to live with for the stock side of your portfolio. But hopefully, this is a good reminder that after properly diversifying in a way that’s right for you, “maintaining patience and discipline, through the bad times and the good, puts investors in position to increase the likelihood of long-term success.”
If we can help you understand this concept more and how it applies to your portfolios, please don’t hesitate to let us know. Also, the full piece from DFA can be found here: A Tale of Two Decades_ Lessons for Long-Term Investors.
Past performance is not a guarantee of future results. Indices are not available for direct investment. Their performance does not reflect the expenses associated with the management of an actual portfolio nor do indices represent results of actual trading. Information from sources deemed reliable, but its accuracy cannot be guaranteed.

Posted by: