


Your Retirement Plan Doesn’t Care About January
Have you heard of the “January Indicator” or “January Barometer?” This theory suggests that the price movement of the S&P 500 during the month of January may signal whether that index will rise or fall during the remainder of the year. In other words, if the return of the S&P 500 in January is negative, this would supposedly foreshadow a fall for the stock market for the remainder of the year, and vice versa if returns in January are positive.

I’ve heard this for years. And I can remember early on in my career probably giving it too much attention. After all, the financial news loves soundbites, and this was one that could grab viewer’s attention as we wonder about the upcoming year. But what does the evidence show us? Have past Januarys’ S&P 500 returns been a reliable indicator for what the rest of the year has in store? More importantly, should we care or worry about it?
This month, we have another picture to help paint a story and hopefully provide perspective. It shows the monthly returns of the S&P 500 Index for each January since 1926 (the yellow dots), compared to the following 11-month return (i.e., the return from February through December, shown as a blue bar). A negative return in January was followed by a positive 11-month return about 60% of the time, with an average return during those 11 months of around 7%.
This suggests that it may not be a good idea to abandon equity markets after a disappointing January. Take 2016, for example: The return of the S&P 500 during the first two weeks was the worst on record for that period, at -7.93%. Even with positive returns toward the end of the month, the S&P 500 returned -4.96% in January 2016, the ninth-worst January return observed from 1926 to 2017. But a subsequent rebound of 18% from February to December resulted in a total calendar year return of almost 13%. An investor reacting to January’s performance by selling out of stocks would have missed out on the gains experienced by investors who stuck with their plan for the whole year. This is a good example of the potential negative outcomes that can result from following investment recommendations based on an “indicator.”
January Return vs. Subsequent 11-Month Return of the S&P 500 Index
1926–2017
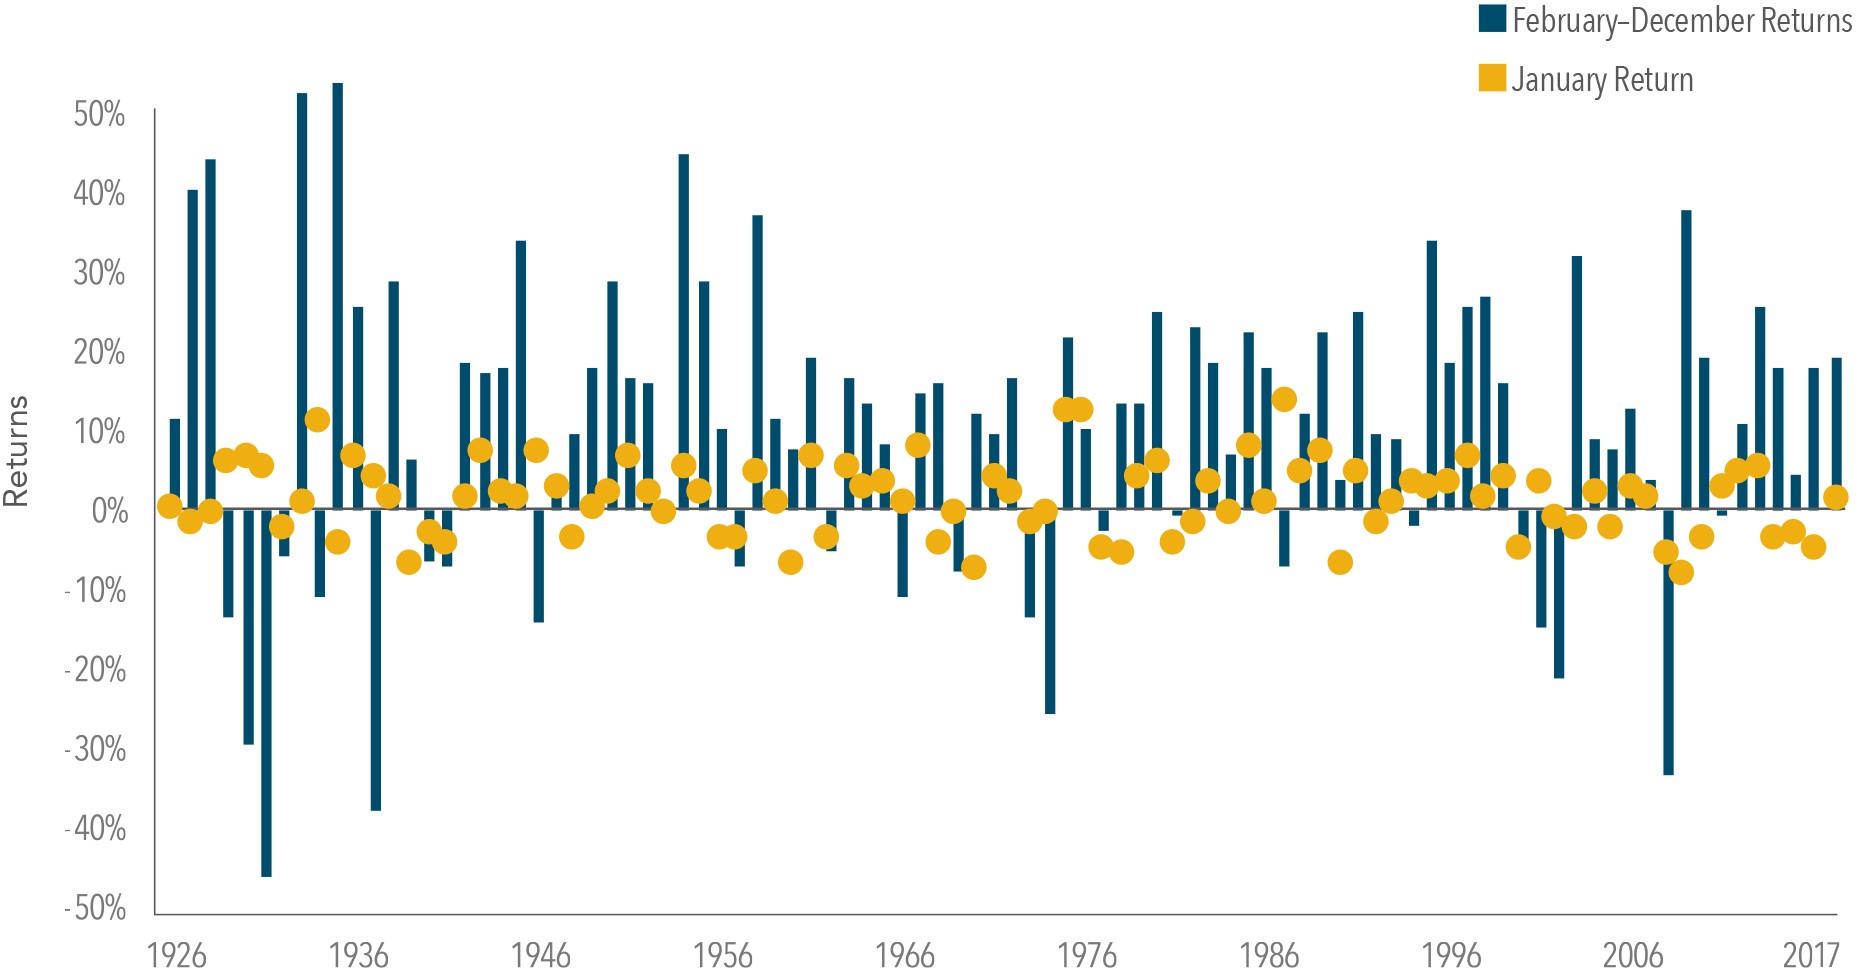
In US dollars. S&P 500 Index data provided by Standard & Poor’s Index Services Group. Past performance is not a guarantee of future results. Indices are not available for direct investment; therefore, their performance does not reflect the expenses associated with the management of an actual portfolio.
What should we make of this?
Over the long term, the financial markets have rewarded patient investors. People expect a positive return and historically, the equity and bond markets have provided meaningful growth of wealth. As you prepare for 2018 and what the year may bring, we should remember that when you remain disciplined and focused on your long-term goals, you can let markets work for you over time. So you can worry less, and enjoy your retirement more.
There is no guarantee investment strategies will be successful. Investing involves risks including possible loss of principal. Diversification does not eliminate the risk of market loss. All expressions of opinion are subject to change. This article is distributed for informational purposes, and it is not to be construed as an offer, solicitation, recommendation, or endorsement of any particular security, products, or services.

Posted by: